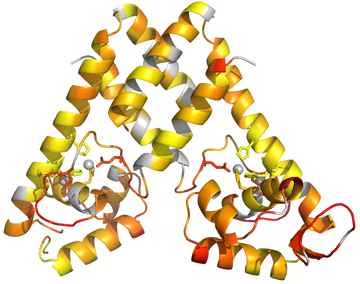
Pymol Color By Data
This post expands on info from a few other blog posts.
-
Your data should be in a tab-delimited text file, formatted like this:
3 0.677985 4 0.794402 5 0.972709 -
You may need to remove extra columns and/or headerscan cause problems. If you exported your file from excel, you may have to change your line break format. From a mac, you might see a bunch of ^M characters in your file. You can use a terminal to do one of these commands to fix the file:
tr '\r' '\n' < macfile.txt > unixfile.txt tr -d '\r' < windowsfile.txt > unixfile.txt - Save this data file to a known location, let’s say /Users/username/Documents/datafile.txt. It might make things easier to avoid having spaces in file or folder names. It seems to be important to use the absolute filename, rather than using shortcuts like
~. - Download data2bfactor.py from http://pldserver1.biochem.queensu.ca/~rlc/work/pymol/.
- Download spectrumany.py from http://pymolwiki.org/index.php/Spectrumany.
- Save these scripts to a known location, let’s say ~/scripts/.
- Open pymol & load your protein structure.
-
Run the scripts you downloaded using the PyMOL> commandline:
PyMOL> run ~/scripts/data2bfactor.py PyMOL> run ~/scripts/spectrumany.py -
Make a named selection for the set of residues you want to color:
PyMOL> select MyChainA, 3TGN and chain A and not resn Zn -
You may want to set all the b-factor data for your selection to 0 or to some other number beforehand, because any residues not mentioned in your data file will retain their original crystallographic B-factor:
PyMOL> alter MyChainA, b=0 -
Now load your data onto your selection using the data2b_res function defined within data2bfactor.py:
PyMOL> data2b_res MyChainA, /Users/username/Documents/datafile.txt -
Now color by B-factor. If you are lucky and the color gradient you want is already included in Pymol, you can use the function spectrum:
PyMOL> spectrum b, rainbow, MyChainA, minimum=0.6, maximum=1 - You will need to play around with minimum and maximum to optimize the image according to your data.
-
If you want a color gradient not already defined in Pymol, you will need to use the spectrumany command:
PyMOL> spectrumany b, red gray80, MyChainA, minimum=0.6,maximum=1 -
Now use the Display menu to make sure the Background is not set to be opaque, and ray trace the image:
PyMOL> ray - Save your image and your session!
