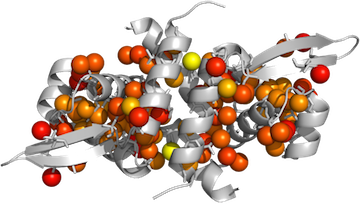
Coloring Methyls in Pymol
This post expands on yesterday’s post that was focused on coloring protein structures by residue in Pymol.
-
Your data should be in a tab-delimited text file, formatted like this:
2 ALA CB 0.03416350 8 ILE CD1 0.43143940 13 LEU CD1 0.50597498 - Make sure you have downloaded data2bfactor.py from http://pldserver1.biochem.queensu.ca/~rlc/work/pymol/.
- Open pymol & load your protein structure.
-
Run any scripts you want to use:
PyMOL> run ~/scripts/data2bfactor.py PyMOL> run ~/scripts/spectrumany.py -
You may want to set all the b-factor data for your protein to –1 or to some other number beforehand, because any residues not mentioned in your data file will retain their original crystallographic B-factor:
PyMOL> alter MyProtein, b=-1 -
Define a selection of all your methyls:
PyMOL> select MyMethyls, (resn ALA and name CB)+(resn ILE and name CD1)+(resn LEU and name CD1+CD2)+(resn MET+MSE and name CE)+(resn VAL and name CG1+CG2)+(resn THR and name CG2) -
Display things nicely:
PyMOL> hide lines PyMOL> show cartoon PyMOL> dss PyMOL> color gray80, MyProtein PyMOL> show spheres, MyMethyls PyMOL> show sticks, resn ALA+ILE+LEU+VAL+MET and not (name c,o,n) -
Now load your data onto your selection using the data2b_atom function defined within data2bfactor.py.
PyMOL> data2b_atom MyMethyls, /Users/username/Documents/datafile.txt -
Apply the color gradient:
PyMOL> spectrumany b, red yellow, methyls - Ray trace, save the image!
