Fun little bioinformatics primers
Here’s a great list of primers on various topics in bioinformatics, published in Nature Biotechnology and PloS Computational Biology. Of course, you need access to these journals to read the articles.
This blog is devoted to little tricks for structural biology.
Here’s a great list of primers on various topics in bioinformatics, published in Nature Biotechnology and PloS Computational Biology. Of course, you need access to these journals to read the articles.
Do you wish you could restrict BLAST results to those genes or organisms that have an NCBI Gene entry that will allow you to explore the genomic context? So do I. I haven’t found the answer yet, but restricting a search to organisms listed here as representative genomes tends to help. Getting all the tax_ids from here can help. This permits searching with an unweildy Entrez Query like
txid208435 [ORGN] OR txid862971 [ORGN] OR txid888833 [ORGN] OR txid1123298 [ORGN] OR txid482234 [ORGN] OR txid862969 [ORGN] OR txid873449 [ORGN] OR txid889201 [ORGN] OR txid1123301 [ORGN] OR txid904293 [ORGN] OR txid486410 [ORGN] OR txid1123302 [ORGN] OR txid552526 [ORGN] OR txid864569 [ORGN] OR txid1123303 [ORGN] OR txid637909 [ORGN] OR txid467705 [ORGN] OR txid1123304 [ORGN] OR txid764299 [ORGN] OR txid471872 [ORGN] OR txid1069533 [ORGN] OR txid68892 [ORGN] OR txid871237 [ORGN] OR txid1318633 [ORGN] OR txid591365 [ORGN] OR txid1076934 [ORGN] OR txid764298 [ORGN] OR txid1116231 [ORGN] OR txid1123306 [ORGN] OR txid1123307 [ORGN] OR txid1123308 [ORGN] OR txid1123309 [ORGN] OR txid210007 [ORGN] OR txid1302863 [ORGN] OR txid927666 [ORGN] OR txid1123311 [ORGN] OR txid1123312 [ORGN] OR txid760570 [ORGN] OR txid936154 [ORGN] OR txid981540 [ORGN] OR txid888746 [ORGN] OR txid1123313 [ORGN] OR txid171101 [ORGN] OR txid170187 [ORGN] OR txid873448 [ORGN] OR txid1054460 [ORGN] OR txid373153 [ORGN] OR txid910313 [ORGN] OR txid160490 [ORGN] OR txid699248 [ORGN] OR txid347253 [ORGN] OR txid388919 [ORGN] OR txid1123317 [ORGN] OR txid1074052 [ORGN] OR txid1156433 [ORGN] OR txid391295 [ORGN] OR txid568814 [ORGN] OR txid299768 [ORGN] OR txid1123318 [ORGN] OR txid1282664 [ORGN] OR txid218495 [ORGN] OR txid764291 [ORGN] OR txid904306 [ORGN] OR txid365659 [ORGN]I just want to point out and reiterate an old forum message about using PyMOL to display ions as spheres. The spheres representation shows the van der Waals radius of an atom. Apparently PyMOL stores the nonionic radii by default, 1.73 A for Mg, for example, rather than 0.71 A for Mg++. If you look up the desired ionic radius:
https://www.webelements.com/nickel/atom_sizes.html
You can set them in PyMOL using the alter command, to obtain a more appropriate picture:
 PyMOL> alter (elem Ni), vdw=0.83
 PyMOL> rebuild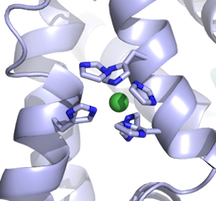
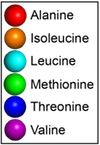
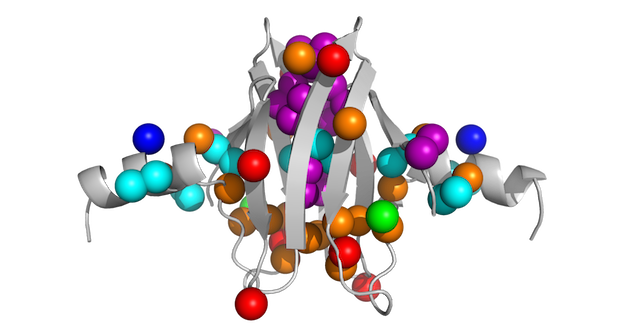
Here is a pymol script to show methyl groups on your protein as spheres, color-coded by residue type.
Download the script here.
Usage: Load the script into pymol using the run… item in the pymol File menu to select this script or load it from the Pymol command line, then actually run it using the showmethyls command:
 PyMOL> run /home/userName/path/toscript/showmethyls.py
 PyMOL> showmethyls
Note that you can use the cd command on the pymol command line as you would in bash/tcsh, if you don’t remember the exact path to the script by heart.
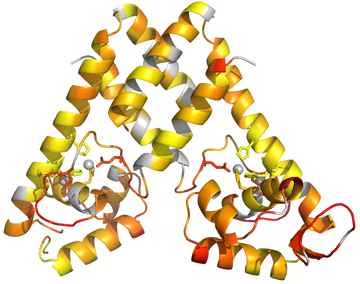
This post expands on yesterday’s post that was focused on coloring protein structures by residue in Pymol.
Your data should be in a tab-delimited text file, formatted like this:
2	ALA	CB	0.03416350
8	ILE	CD1	0.43143940
13 LEU CD1 0.50597498Run any scripts you want to use:
PyMOL> run ~/scripts/data2bfactor.py
PyMOL> run ~/scripts/spectrumany.py
You may want to set all the b-factor data for your protein to –1 or to some other number beforehand, because any residues not mentioned in your data file will retain their original crystallographic B-factor:
PyMOL> alter MyProtein, b=-1Define a selection of all your methyls:
PyMOL> select MyMethyls, (resn ALA and name CB)+(resn ILE and name CD1)+(resn LEU and name CD1+CD2)+(resn MET+MSE and name CE)+(resn VAL and name CG1+CG2)+(resn THR and name CG2)Display things nicely:
PyMOL> hide lines
PyMOL> show cartoon
PyMOL> dss
PyMOL> color gray80, MyProtein
PyMOL> show spheres, MyMethyls
PyMOL> show sticks, resn ALA+ILE+LEU+VAL+MET and not (name c,o,n)
Now load your data onto your selection using the data2b_atom function defined within data2bfactor.py.
PyMOL> data2b_atom MyMethyls, /Users/username/Documents/datafile.txtApply the color gradient:
PyMOL> spectrumany b, red yellow, methyls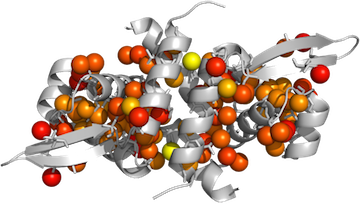
This post expands on info from a few other blog posts.
Your data should be in a tab-delimited text file, formatted like this:
3	0.677985
4	0.794402
5	0.972709
You may need to remove extra columns and/or headerscan cause problems. If you exported your file from excel, you may have to change your line break format. From a mac, you might see a bunch of ^M characters in your file. You can use a terminal to do one of these commands to fix the file:
tr '\r' '\n' < macfile.txt > unixfile.txt
tr -d '\r' < windowsfile.txt > unixfile.txt~.Run the scripts you downloaded using the PyMOL> commandline:
PyMOL> run ~/scripts/data2bfactor.py
PyMOL> run ~/scripts/spectrumany.py
Make a named selection for the set of residues you want to color:
PyMOL> select MyChainA, 3TGN and chain A and not resn ZnYou may want to set all the b-factor data for your selection to 0 or to some other number beforehand, because any residues not mentioned in your data file will retain their original crystallographic B-factor:
PyMOL> alter MyChainA, b=0Now load your data onto your selection using the data2b_res function defined within data2bfactor.py:
PyMOL> data2b_res MyChainA, /Users/username/Documents/datafile.txtNow color by B-factor. If you are lucky and the color gradient you want is already included in Pymol, you can use the function spectrum:
PyMOL> spectrum b, rainbow, MyChainA, minimum=0.6, maximum=1If you want a color gradient not already defined in Pymol, you will need to use the spectrumany command:
PyMOL> spectrumany b, red gray80, MyChainA, minimum=0.6,maximum=1Now use the Display menu to make sure the Background is not set to be opaque, and ray trace the image:
PyMOL> ray